
Win more instructions with Zoopla Masterclass
12 May 2026Get an edge with exclusive lessons from industry expert Ian Preston.
Read more
UK house prices continue to show modest growth, up 1.4% year on year in June 2026, supported by easing mortgage rates and resilient demand in many regions. Market activity varies across the UK, with improving affordability helping to stabilise conditions.
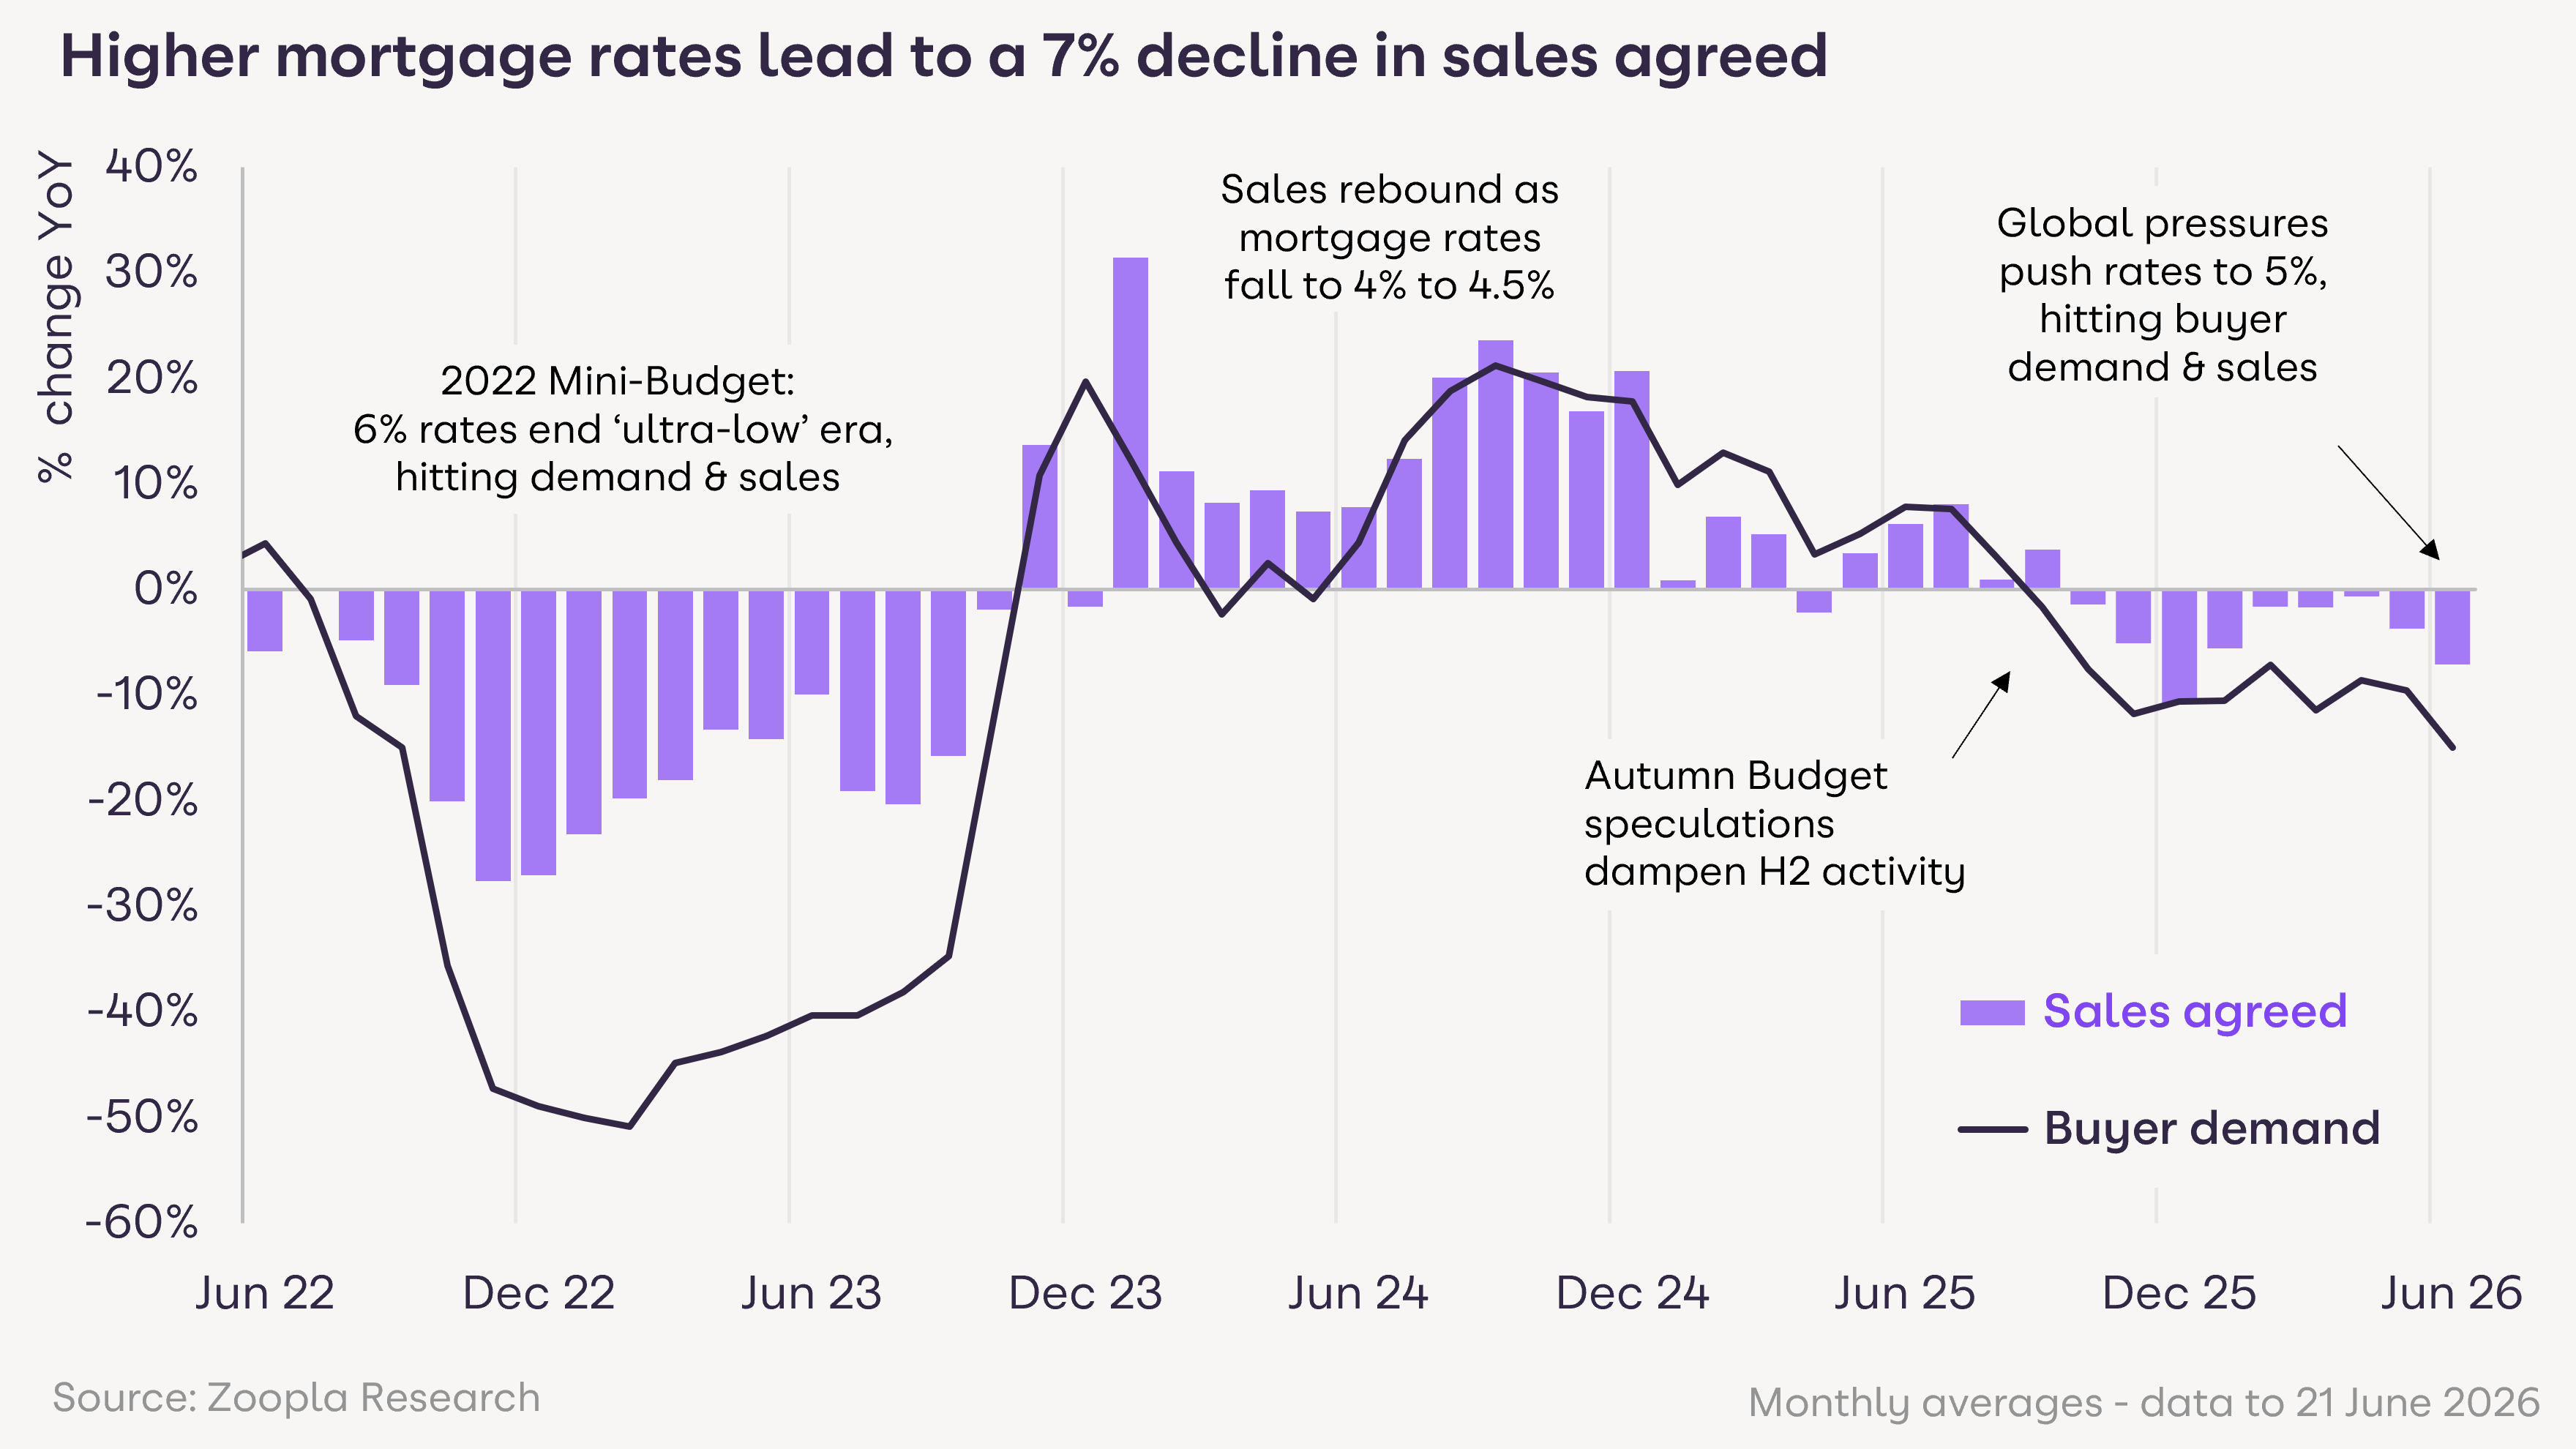
Higher mortgage rates and political uncertainty have shrunk the pool of home buyers - sales agreed are 7% lower in June
House price inflation has edged lower to 1.4%
Mortgage rates peaked at 5% in April having started the year at 4% and are now falling. The cash cost for buyers varies widely
Mortgage costs are £244 a month higher in London but just £69 in the North East since January
Sales are down in across areas and house price inflation varies from 3.5% in northern England to small price falls in the south
We expect price inflation to drift lower in H2, while sales agreed are on track to be 6-8% lower than last year at 1.1m completions
Join Zoopla for the data, tools and leads that make the difference in a finely balanced market
The desire to move home remains strong but the recent jump in mortgage rates and political uncertainty have shrunk the pool of committed home buyers.
Sales agreed over June are running 7% below with buyer enquiries 15% lower, a consistent trend this year.
A change of Prime Minister and questions over likely tax and spending priorities in the Autumn Budget have added to the uncertainty in recent weeks, which is reflected in other measures of consumer confidence.
More buyers are taking a wait-and-see approach until the outlook becomes clearer. This is not the first time the market has absorbed economic and political uncertainty.
The 2022 mini-budget triggered a far sharper fall in sales and on both previous occasions the market recovered once mortgage rates stabilised and started moving lower.
Download the House Price Index, June 2026 (PDF, kB)
Property type | Average house price February 2026 | Average house price March 2026 | Average house price April 2026 | Annual price change to April 2026 (£) | Annual price change to April 2026 (%) |
All property | £271,000 | £271,700 | £271,900 | £4,030 | 1.50% |
Flats/maisonettes | £192,400 | £192,500 | £193,000 | -£2,540 | -1.30% |
Terraced houses | £240,700 | £240,800 | £241,600 | £4,120 | 1.70% |
Semi-detached houses | £280,700 | £280,600 | £281,800 | £6,750 | 2.50% |
Detached houses | £457,000 | £456,800 | £458,700 | £7,480 | 1.70% |
Connect with our homeowner audience to win more instructions and grow your market share.

Average mortgage rates were less than 4% in January and peaked in April at almost 5%. This added around £125 a month to the cost of a typical mortgage on the average UK home or £1,500 a year.
Higher mortgage rates do not have a uniform impact and this has a straight flow through into sales activity and house price inflation.
In London, this extra cost for a home buyer is £244 a month (£2,900 a year) but just £69 a month (£830 a year) in the North East.
For a first-time buyer in London the monthly repayment increased by £232 at the April peak: nearly three and a half times the £66 monthly increase facing a first-time buyer in the North East.
It’s positive that mortgage rates have already started to fall, edging lower in May to an average of 4.8%. The decline in borrowing costs needs to go further to improve affordability and support housing sales in the second half of 2026.
Slower sales are feeding through into UK price inflation, which has edged lower to 1.4% in May.
The current index reflects sales agreed earlier in the year before the full impact of higher rates was felt over April.
We expect price inflation to move lower into the autumn unless mortgage rates fall below around 4.5% and sales recover.
House prices are rising at 3.5% across the North East and North West and at 3.0% in Scotland, where supply remains tight.
London has recorded negative annual price growth for nine consecutive months at -0.2% and the South East is at -0.3%. For sellers in London and the South, getting the asking price right is essential and the difference between moving and not moving this year.
Speak to our team to get started and grow faster in your local market.

Annual house price inflation is running at 1.4% and we expect this to soften further towards 1% over the second half of the year with prices in the North of England and Scotland holding firmer than in the South.
Prices in London and the South East are set to remain flat to negative. Mortgage rates need to fall below 4.5% to improve affordability and bring buyers back into the market.
The selection of a new Prime Minister and the Autumn Budget are key moments that will influence buyer confidence beyond pure affordability factors.
Sales agreed have weakened in recent weeks but were broadly in line with 2025 through the spring. With sales in H2 2025 suppressed by Autumn Budget speculation, the year-on-year comparison is likely to narrow through Q3 and Q4 even without a significant recovery in buyer demand and sales.
At the start of the year, we expected sales would be 2% below their high of 2025. This gap will be wider on the back of higher borrowing costs reducing sales activity.
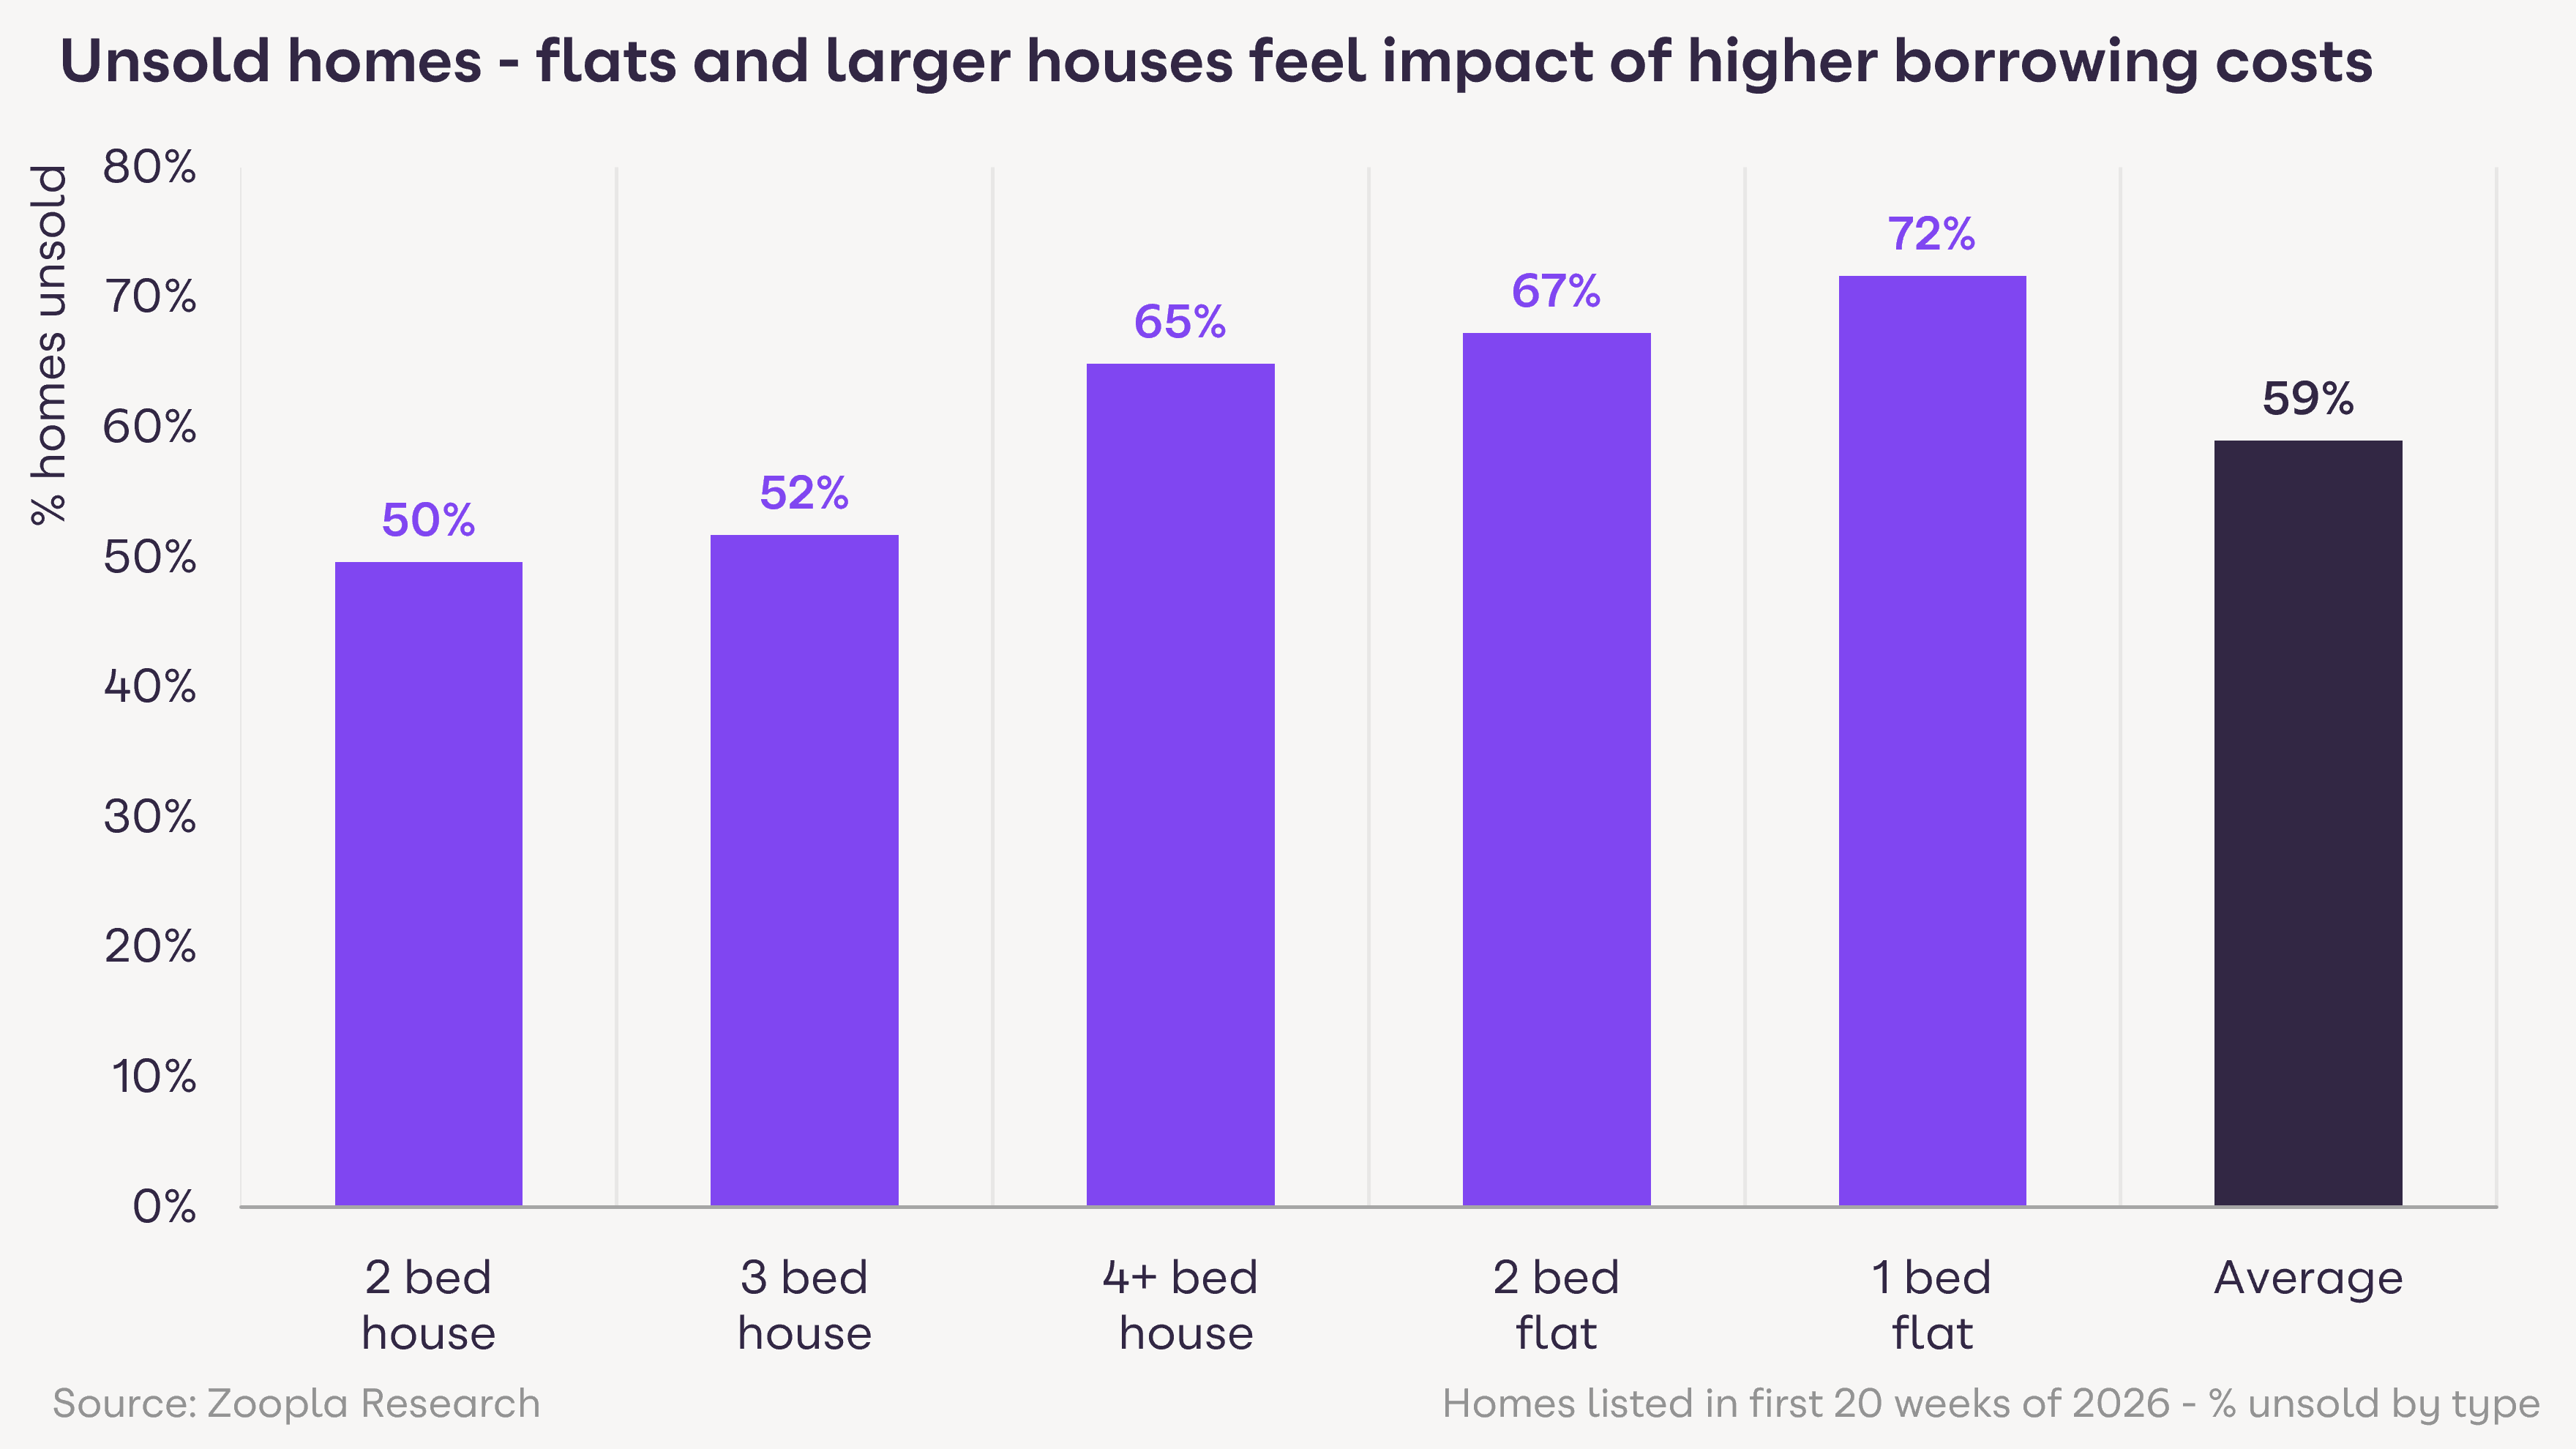
Stock levels remain elevated in southern England giving buyers plenty of choice and keeping price inflation in check.
Pricing conversations with sellers remain very important as getting the price right from the outset will define whether a home sells. Buyers are being selective but well-priced homes are still selling.
The First-time buyer segment is the most rate-sensitive and London FTBs are the most squeezed and this is where any further rate falls will have the most immediate impact on demand and activity.
The Zoopla House Price Index (HPI) tracks the change in achieved sales price of homes (not asking prices). The index uses sold prices, mortgage valuations and data for recently agreed sales with more input data than any other index. The methodology is designed to accurately track the change in pricing for UK housing. It’s revisionary and non-seasonally adjusted.
Notes on this month’s data:
Sales and buyer activity data compares the four weeks to 23 June 2026 with the same period in 2025.
Average mortgage rates are based on new 75% loan-to-value (LTV), five-year fixed-rate mortgages, using Bank of England Bankstats data.
Mortgage repayment estimates assume a 75% LTV mortgage over a 30-year term, using the average five-year fixed mortgage rate and the average UK house price.
Based on residential resale homes listed for sale across Great Britain during the first 20 weeks of 2026 that had not been marked as Sold or Sold Subject to Contract, allowing for a typical marketing period.
Source: Zoopla calculations based on buyer enquiry data.
We try to make sure that the information here is accurate at the time of publishing. But the property market moves fast and some information may now be out of date. Zoopla accepts no responsibility or liability for any decisions you make based on the information provided.
Get an edge with exclusive lessons from industry expert Ian Preston.
Read more
With unrealistic pricing by sellers the key reason homes are unlikely to sell, our latest research explores how agents might help reset their expectations and win instructions rooted in achievable pricing.
Read more
After 18 months of testing AI in our platforms, this agreement with OpenAI will accelerate our ability to innovate and support faster transactions for agents and housebuilders.
Read more