
Rental Market Report September 2026
14 Sept 2026Rental growth is picking up as supply starts to fall. Our latest report looks at what this means for landlords and letting agents, and where the opportunities are in the rental market.
Read more
UK rents are still rising but at a slower rate than in 2025
Rents in the majority of local authorities are rising faster than the UK average, creating headroom for rent increases
Tracking localised rents establishes the open-market value where you are – a critical figure that helps you to estimate and justify rent levels
Our breakdown of rents by region, city and local authority will help shape the valuations you provide landlords and guide rent increases
Rents increased by an average of 2.1% in the last year – a slightly slower rate of growth than in 2025, when it was 2.2%. New UK tenancies are costing renters £1,321 per month (or £15,852 a year), as detailed in our latest Rental Market Report (June 2026).
| Avg. rent (pcm) | Annual rental growth (%) | Annual rental growth (£) |
United Kingdom | £1,321 | 2.10% | £30 |
United Kingdom, excluding London | £1,082 | 2.10% | £20 |
Better value, clearer results. Discover the new Zoopla packages, designed to help agents grow.

Rents are rising faster than the national average in 75% of local authorities, with limited supply and shifting demand driving growth.
Our data shows the cheaper the rent, the greater the year-on-year increase. For example, annual growth peaked at 23.7% in Barrow-in-Furness, where rents are just £682 per calendar month (pcm). In contrast, only 5.8% of local authorities recorded annual rent decreases.
Widespread price growth is down to 25% fewer rental homes on the market now than before the pandemic, together with renters gravitating towards affordable areas.
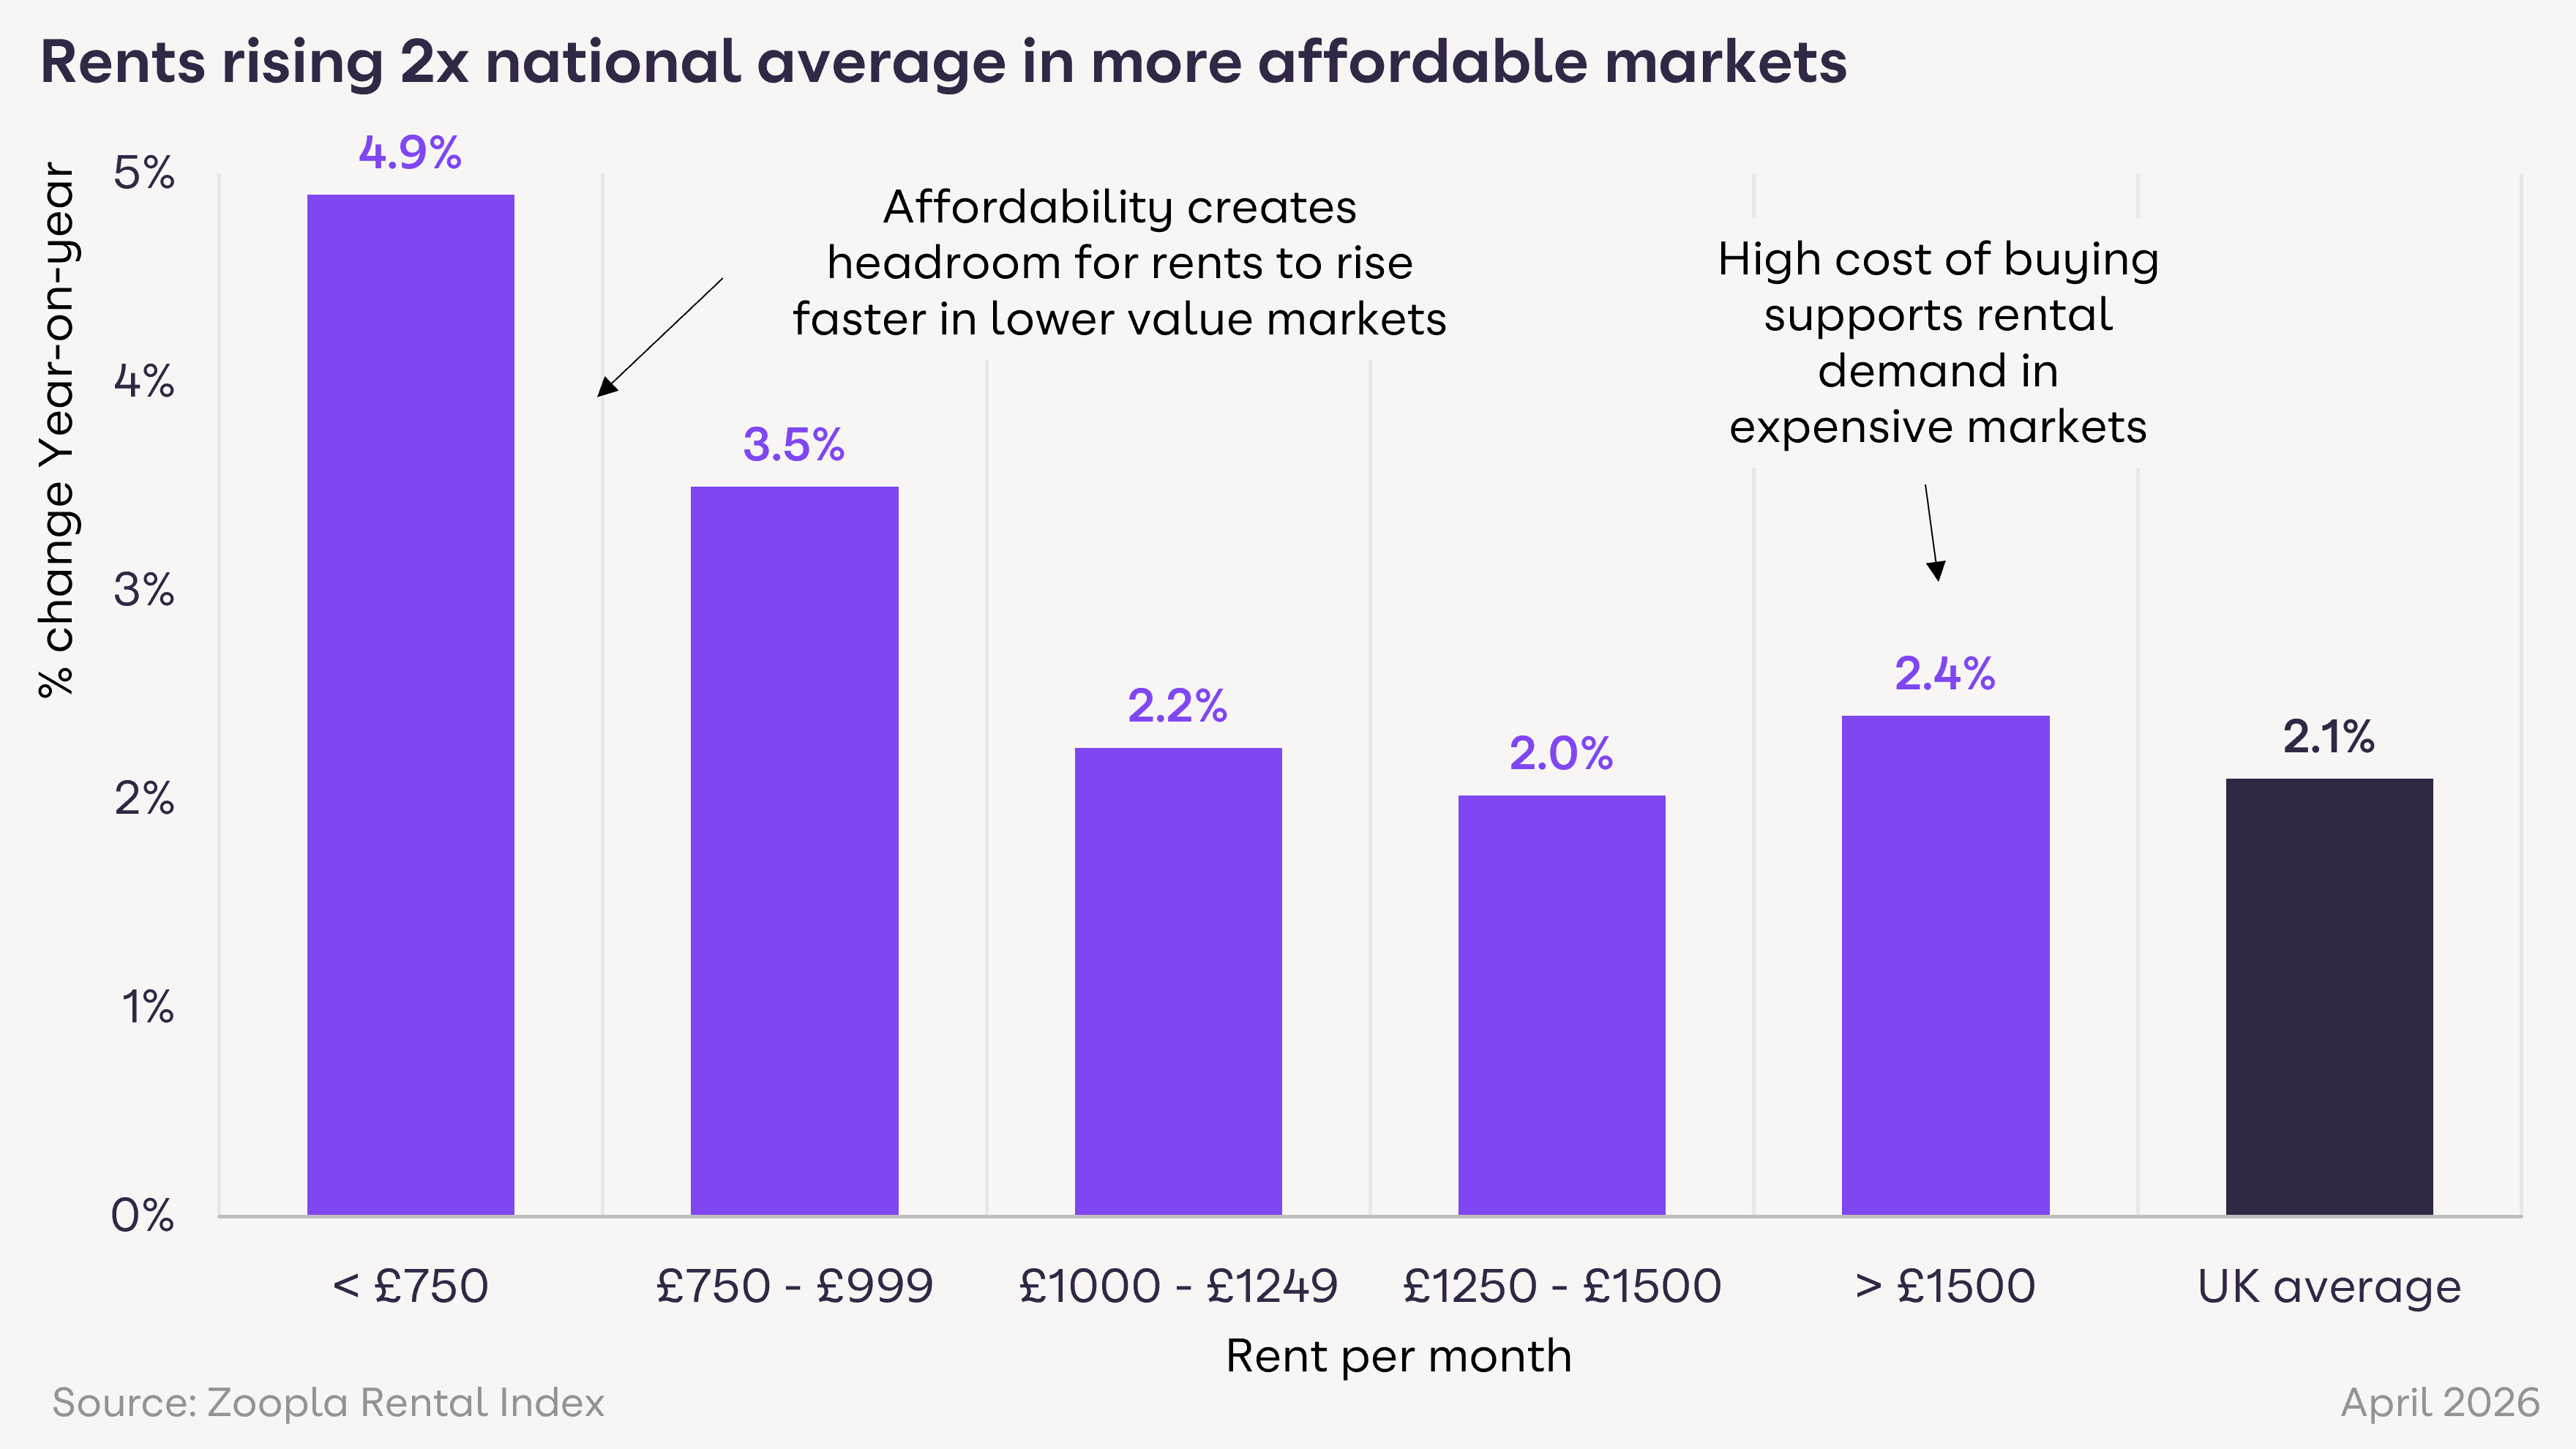
Tracking local values has always influenced the cost of new tenancies but in 2026, having local market data has become more important than ever.
The Renters’ Rights Act has limited rent rises in England to once per year, reflecting the rules in Scotland and Wales. Any increase must be in line with open-market values and tenants are encouraged to challenge a hike they feel is unfair.
A tribunal will use comparable local properties and recently achieved rents to determine the open market rent. Our data provides a factual starting point for agents, improving outcomes should the rent be challenged.
On the flipside, rents are rising fast in many local authorities and there could be room to increase what tenants pay. Knowing how local rents have increased is vital for fulfilling landlords’ income potential and ensuring increases are fair.
The North East is home to the UK’s cheapest rent at £766 pcm – a figure that’s risen 3.9% in the last year.
It’s followed by Yorkshire and The Humber (£866 pcm), Scotland (£885 pcm) and Northern Ireland (£889 pcm).
London’s average rent of £2,207 pcm makes it the most expensive region in the UK. The capital is followed by the South East, the East of England and the South West.
Region | Average rent per month | Annual rental growth (%) | Annual rental growth (£) |
North East | £766 | 3.90% | £30 |
Yorkshire and the Humber | £866 | 3.50% | £30 |
Scotland | £885 | 1.50% | £10 |
Northern Ireland | £889 | 6.90% | £60 |
East Midlands | £920 | 1.20% | £10 |
Wales | £953 | 1.70% | £20 |
North West | £961 | 3.20% | £30 |
West Midlands | £977 | 0.50% | £0 |
South West | £1,152 | 2.50% | £30 |
East of England | £1,250 | 1.90% | £20 |
South East | £1,391 | 1.60% | £20 |
London | £2,207 | 2.20% | £50 |
Tap into our well-known brand, unique audiences and pipeline of motivated movers.
There is a distinct North-South divide when it comes to city rents. The top 10 cheapest cities are all in the North. Barnsley is the most affordable at £646 pcm. The most expensive list is dominated by Southern cities, with the exception of Edinburgh.
City | Average rent per month | Annual rental growth (%) | Annual rental growth (£) |
Burnley | £646 | 3.90% | £20 |
Middlesbrough | £671 | 4.20% | £30 |
Sunderland | £672 | 2.50% | £20 |
Hull | £678 | 4.80% | £30 |
Grimsby | £695 | 3.20% | £20 |
Aberdeen | £721 | 0.60% | £0 |
Barnsley | £744 | 4.80% | £30 |
Blackpool | £749 | 4.90% | £30 |
Doncaster | £754 | 4.20% | £30 |
Bradford | £763 | 2.00% | £10 |
Area Name | Avg. Rent PCM | Annual Rental Growth (%) | Annual rental growth (£) |
London | £2,134 | 2.20% | £50 |
Oxford | £1,794 | 5.80% | £100 |
Brighton | £1,605 | -0.10% | £0 |
Cambridge | £1,588 | -0.40% | -£10 |
Crawley | £1,473 | 1.20% | £20 |
Bristol | £1,415 | 3.70% | £50 |
Aldershot | £1,387 | 2.40% | £30 |
Reading | £1,382 | -0.20% | £0 |
Edinburgh | £1,348 | 1.80% | £20 |
Milton Keynes | £1,275 | 1.70% | £20 |
The heat is disappearing from some city rental markets, while it’s building in others. For example, rental growth of 6.5% means there’s only £90 difference between rents in Birmingham and in Telford.
City | Avg. Rent PCM | Annual Rental Growth (%) | Annual rental growth (£) |
Belfast | £906 | 8.10% | £70 |
Gloucester | £1,049 | 7.10% | £70 |
Telford | £916 | 6.50% | £60 |
Only 10 of the 64 cities we tracked saw rents fall in the last year. The biggest decreases were recorded in Peterborough (-2.2%), Hastings (-2.1%) and Coventry (-2%).
City | Avg. Rent PCM | Annual Rental Growth (%) | Annual rental growth (£) |
Peterborough | £936 | -2.20% | -£20 |
Hastings | £1,047 | -2.10% | -£20 |
Coventry | £1,007 | -2.00% | -£20 |
Some London rents increased by more than double the national average. Merton (4.9%), Richmond upon Thames (4.9%) and Bromley (4.3%) were the top three boroughs for annual growth. This suggests renters are moving from inner to outer London for better value.
Local authority | Average rent (pcm) | Annual rental growth (%) | Annual rental growth (£) |
Croydon | £1,590 | 1.30% | £20 |
Sutton | £1,594 | 3.20% | £50 |
Bexley | £1,631 | 3.60% | £60 |
Local authority | Avg. Rent PCM | Annual Rental Growth (%) | Annual rental growth (£) |
Camden | £2,779 | 3.30% | £90 |
City of Westminster | £3,297 | 2.50% | £80 |
Kensington and Chelsea | £3,568 | 0.80% | £30 |
Hartlepool is the cheapest place to rent in the UK, with a low average rent of £580 pcm. Rents in Newcastle upon Tyne now exceed £1,000 pcm.
Local authority | Avg. Rent PCM | Annual Rental Growth (%) | Annual rental growth (£) |
Hartlepool | £580 | 2.20% | £10 |
Redcar and Cleveland | £629 | 3.10% | £20 |
County Durham | £638 | 3.50% | £20 |
Local authority | Average rent (pcm) | Annual rental growth (%) | Annual rental growth (£) |
Newcastle upon Tyne | £1,081 | 4.50% | £50 |
Gateshead | £769 | 4.50% | £30 |
Northumberland | £731 | 5.60% | £40 |
Rents are almost half the national average in North East Lincolnshire and North
Lincolnshire. York’s rent of £1,186 pcm exceeds the UK average when London is excluded.
Local authority | Average rent (pcm) | Annual rental growth (%) | Annual rental growth (£) |
Kingston upon Hull | £678 | 4.80% | £30 |
North East Lincolnshire | £695 | 3.20% | £20 |
North Lincolnshire | £714 | 4.20% | £30 |
Local authority | Average rent (pcm) | Annual rental growth (%) | Annual rental growth (£) |
York | £1,186 | 5.80% | £70 |
Harrogate | £1,100 | 6.50% | £70 |
Craven | £930 | 8.00% | £70 |
Rents in East Ayrshire, Dumfries and Galloway and North Ayrshire are some of the UK’s cheapest but each registered above average annual growth. This marks a clear trend for renters seeking cheaper fringe areas that are commutable to Edinburgh and Glasgow.
Local authority | Average rent (pcm) | Annual rental growth (%) | Annual rental growth (£) |
East Ayrshire | £621 | 15.70% | £80 |
Dumfries and Galloway | £634 | 6.70% | £40 |
North Ayrshire | £687 | 2.60% | £20 |
Local authority | Avg. Rent PCM | Annual Rental Growth (%) | Annual rental growth (£) |
City of Edinburgh | £1,348 | 1.80% | £20 |
East Lothian | £1,184 | 5.70% | £60 |
East Renfrewshire | £1,174 | 4.40% | £50 |
Annual rental growth is close to the national average in the East Midlands, indicating the cheapest rents are close to their ceiling limit. In contrast, the region’s most expensive authority (South Northamptonshire) has recorded rent growth that’s more than triple the UK average (6.5%).
Local authority | Avg. Rent PCM | Annual Rental Growth (%) | Annual rental growth (£) |
East Lindsey | £709 | 2.40% | £20 |
Bolsover | £760 | 2.60% | £20 |
Mansfield | £762 | 3.40% | £30 |
Local authority | Average rent (pcm) | Annual rental growth (%) | Annual rental growth (£) |
South Northamptonshire | £1,252 | 6.50% | £70 |
Rushcliffe | £1,064 | 4.90% | £70 |
Harborough | £1,082 | 4.60% | £70 |
Only one local authority in Wales – Gwynedd – saw rents fall in the last year. Growth was most notable in the Isle of Anglesey (8.8%) and Monmouthshire (8.7%).
Local authority | Average rent (pcm) | Annual rental growth (%) | Annual rental growth (£) |
Blaenau Gwent | £712 | 4.80% | £30 |
Powys | £725 | 2.80% | £20 |
Merthyr Tydfil | £752 | 1.00% | £10 |
Local authority | Avg. Rent PCM | Annual Rental Growth (%) | Annual rental growth (£) |
Cardiff | £1,209 | 1.50% | £20 |
Monmouthshire | £1,105 | 8.70% | £90 |
Vale of Glamorgan | £1,051 | 3.30% | £30 |
Barrow-in-Furness has seen the biggest rental growth of any UK local authority, recording a jump of 23.7%. The North West’s best value can be found in Burnley, while the Manchester area is the most expensive.
Local authority | Avg. Rent PCM | Annual Rental Growth (%) | Annual rental growth (£) |
Burnley | £626 | 3.80% | £20 |
Barrow-in-Furness | £682 | 23.70% | £130 |
Pendle | £683 | 4.10% | £30 |
Local authority | Average rent (pcm) | Annual rental growth (%) | Annual rental growth (£) |
Manchester | £1,282 | 2.90% | £40 |
Trafford | £1,219 | 1.70% | £20 |
Salford | £1,115 | 1.00% | £10 |
With rents in Birmingham, Solihull, Warwick and Stratford-upon-Avon commonly exceeding £1,000 pcm, people are considering outlying areas like Stoke-on-Trent. In Staffordshire Moorlands, rents are rising three times as fast as the UK average.
Local authority | Avg. Rent PCM | Annual Rental Growth (%) | Annual rental growth (£) |
Stoke-on-Trent | £753 | 2.30% | £20 |
Staffordshire Moorlands | £794 | 6.60% | £50 |
East Staffordshire | £833 | 2.30% | £20 |
Local authority | Average rent (pcm) | Annual rental growth (%) | Annual rental growth (£) |
Warwick | £1,209 | 1.70% | £20 |
Solihull | £1,173 | 1.60% | £20 |
Stratford-on-Avon | £1,135 | 2.90% | £30 |
South West lovers should look outside of Cornwall and Somerset for the cheapest rents. Devon hits the affordable spot but it’s a county with above-average rental growth.
Local authority | Avg. Rent PCM | Annual Rental Growth (%) | Annual rental growth (£) |
North Devon | £853 | 4.60% | £40 |
Torridge | £863 | 5.20% | £40 |
West Devon | £890 | 3.70% | £30 |
Local authority | Average rent (pcm) | Annual rental growth (%) | Annual rental growth (£) |
Bath and North East Somerset | £1,626 | 2.40% | £40 |
Bristol | £1,436 | 3.20% | £40 |
South Gloucestershire | £1,376 | 4.40% | £60 |
Fenland in Cambridgeshire was one of the few districts in the UK where rents dropped in the last year. Commuter hotspots are home to the most expensive rents but Epping Forest and St. Albans have seen rental growth dip below the UK average.
Local authority | Avg. Rent PCM | Annual Rental Growth (%) | Annual rental growth (£) |
Fenland | £842 | -0.50% | £0 |
Waveney | £842 | 6.90% | £50 |
Great Yarmouth | £856 | 1.40% | £10 |
Local authority | Average rent (pcm) | Annual rental growth (%) | Annual rental growth (£) |
Epping Forest | £1,721 | 1.60% | £30 |
Three Rivers | £1,707 | 3.40% | £60 |
St. Albans | £1,687 | 2.00% | £30 |
Rents are still rising in Thanet but there are signs, however, that rents in Hastings have passed their peak. Values here dropped 2.1% in the last year. Oxford has seen the highest level of rental growth in the South East (5.8%).
Local authority | Avg. Rent PCM | Annual Rental Growth (%) | Annual rental growth (£) |
Isle of Wight | £952 | 0.60% | £10 |
Thanet | £1,019 | 0.10% | £0 |
Hastings | £1,047 | -2.10% | -£20 |
Local authority | Average rent (pcm) | Annual rental growth (%) | Annual rental growth (£) |
Oxford | £1,794 | 5.80% | £100 |
Guildford | £1,781 | 2.20% | £40 |
South Bucks | £1,750 | 1.00% | £20 |
We try to make sure that the information here is accurate at the time of publishing. But the property market moves fast and some information may now be out of date. Zoopla accepts no responsibility or liability for any decisions you make based on the information provided.
Rental growth is picking up as supply starts to fall. Our latest report looks at what this means for landlords and letting agents, and where the opportunities are in the rental market.
Read moreAs the landmark Renters' Rights Act reshapes the private rental sector, we have launched a suite of educational content to help letting agents target the 4 in 5 landlords who currently self-manage.
Read more
Stock is up 7% and sales are down 7%. See what the October data means for pricing conversations and for winning instructions.
Read more